I went to Generosity Index at the Catalogue for Philanthropy, where I found the underlying data about itemized charitable contributions vs. income, by State. The measure of income used to compute the Generosity Index is adjusted gross income. To get a truer picture of the propensity to give to charity, I converted adjusted gross income to after-tax income by calculating and applying an effective tax rate for each State based on its Tax Freedom Day (detailed data here). With that result in hand I calculated each State's average itemized charitable contributions as a percentage of average after-tax income. I plotted that statistic against the percentage of votes cast for Bush in 2004, by State.
The relationship between after-tax giving and Bush votes is indicated by the black plot points in the following graph:
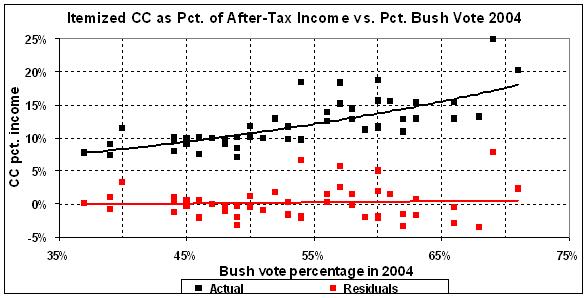
The best regression fit for the relationship between after-tax charitable giving and Bush votes is an exponential (the black line):
Itemized charitable contributions as percentage of after-tax income =The exponential fit indicates that the rate of after-tax giving accelerates as the percentage of Bush votes increases. Moreover, the fit -- as good as it is -- understates the rate of acceleration, as can be seen by inspecting the residuals (the differences between the regression estimates and the actual data), which are plotted in red. Note that the four largest residuals are positive (that is, the equation underestimates charitable giving) and represent pro-Bush States, with vote percentages of 54, 57, 60, and 69.
0.0304e^2.5026 x (percentage of votes cast for Bush in 2004)
R-squared = 0.59
You might think that the higher rate of giving among Red States is the result of lighter tax burdens in those States. It is true that Red States generally have lighter tax burdens than Blue States, as the following graph attests:
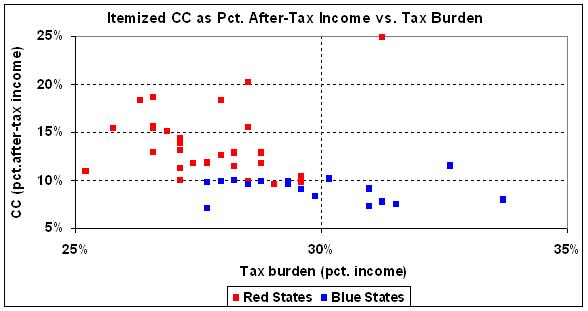
But you can see readily that -- given the same tax burden -- Red States outstrip Blue States in charitable giving. You can see, also, that there is a strong negative relationship between taxes and charitable giving. It doesn't show up in the data for the Blue States, which are almost uniformly parsimonious when it comes to charitable giving, but it's definitely there in the case of the Red States. For all States (with the exception of Wyoming, the far "outlier" at the top of the graph), a linear regression yields a one-to-one negative relationship between the tax burden and charitable giving; that is, for every 1 percentage point rise in the tax burden, after-tax charitable giving drops by 1 percentage point.
I draw two conclusions:
- There is a significant, positive relationship between Republicanism and charitable giving, as indicated by both graphs.
- Taxes crowd out charity (no surprise), as indicated by the second graph.

