Background
As defined by the FBI, violent crime comprises murder, forcible rape, robbery, and aggravated assault; property crime comprises burglary, larceny-theft, and motor-vehicle theft. Here are the numbers:
 Steven Levitt, of Freakonomics fame, has hypothesized thusly about the drop in the violent-crime rate: more abortion (because legal), therefore fewer illegitimate babies, therefore fewer "unwanted" babies, therefore fewer young men (about 18 years later) whose upbringing was bound to have included more than a normal share of neglect and abuse, therefore less violent crime.
Levitt focuses on violent crime, which (conveniently for him) peaked just as the first abortion generation failed to come of age. But property crime, which is eight times more prevalent than violent crime, peaked about ten years earlier. Property crime, if Levitt is right, must be the preserve of pre-adolescent or middle-aged criminals. It is far more likely that Levitt is wrong.
Several months before I became aware of Levitt's hypothesis, I said this:
According to an article in today's NYTimes.com, "Most Crimes of Violence and Property Hover at 30-Year Lows." Three important things happened after 1995 -- the year in which the rate of violent crime began to drop markedly. First, the incarceration rate continued to rise: Persistence pays off. Second, the percentage of the population that is male and 20-24 years old continued to drop, in keeping with the general aging of the population. (Age usually brings with it a greater degree of maturity, stability, and aversion to committing criminal acts.) At the same time, spending on criminal justice functions (police, corrections, and courts) continued to rise, especially spending on police.I later backed it up with this:
I'm sure there are other causal factors, but those are probably the big ones. The first and third of those factors -- incarceration and spending on the criminal justice system -- go hand in hand. And they are the public-policy weapons of choice in a society that values individual responsibility. (May 15, 2005)
Rather than rehash all the debates about Levitt's work..., I decided to take a fresh look at the numbers. I drew on the U.S. Census Bureau's "Mini-Historical Statistics" to derive the following statistics for the United States (each descriptor links to the Excel spreadsheet from which I derived the relevant statistics):Violent crimes per 100,000 personsI selected the 15-24 year age range because persons in that age bracket are most prone to the commission of violent crimes. Because the midpoint of that age bracket is approximately 19, I lagged the birth statistics by 19 years so that birth rates in a particular year are measured against crime statistics 19 years later (e.g., births in 1960 vs. crime in 1977, births in 1973 vs. crime in 1990). I used the overall rate of incarceration rather than a rate for violent offenders because locking up offenders of any kind must ensure that persons who would otherwise commit violent crimes are unable to do so.
Percentage of population aged 15-24
Births and illegitimate births per 100,000 women aged 15-19
Blacks as a percentage of the population
Persons incarcerated per 100,000
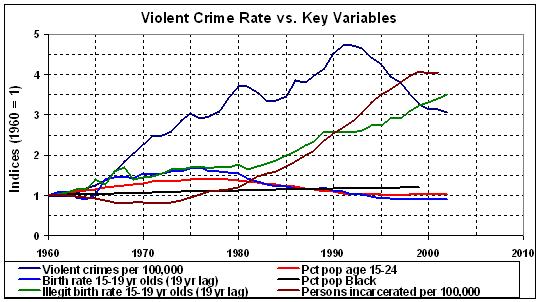
Before plunging into a regression analysis, I indexed the series to 1960 (the first year in the violent-crime series) and plotted them (again, with a 19-year lag on the birth-rate series). Here are the plots:
The relationships suggest strongly that the legalization of abortion did not have a significant effect on the rate of violent crime in the U.S. The violent-crime rate rose almost steadily from 1960 until 1991, when it peaked. The lagged rate of illegitimate births for women aged 15-19 (probably the best available proxy for "unwanted" children) leveled off about when the crime rate peaked, but the illegitimacy rate then resumed its steady rise, even as the violent-crime rate dropped dramatically. It is therefore improbable (if not impossible) that abortion -- as measured by the rate of illegitimate births -- had anything to do with the drop in the crime rate. Using the total rate of births for women aged 15-19 as a proxy for "unwantedness" yields even more problematic results: the lagged rate peaked in 1976, fully 15 years before the crime rate peaked.
I nevertheless ran many regressions on the violent-crime rate and various combinations of the key variables. Only one regression yields credible results (high R-squared, standard error of estimate among the lowest, intuitively correct signs on all coefficients, and high t-statistics on all coefficients). That regression takes the following form:Number of violent crimes per 100,000 persons =
- 3723
+ 37058 x number of Blacks as a decimal fraction of the population
- 0.568 x number of persons incarcerated per 100,000 of population
The t-statistics on the intercept and coefficients are 15.854, 17.047, and 5.042, respectively; the adjusted R-squared is 0.936; [the standard error of the estimate/mean value of dependent variable = 0.097].
(January 3, 2006)New Numbers
I have since extended my analysis, in time and in scope. I have looked at the rate of violent-plus-property crimes; I have added data for the five years from 2000 through 2004; and I have considered as explanatory variables the existence of mandatory federal sentencing guidelines (1989-2004), number of male enlisted personnel in the armed forces (in proportion to population), and year-over-year growth in real GDP per capita -- in addition to the number of persons aged 15-24, number of prisoners, and number of blacks in proportion to total population, as before. (For sources, see the footnote to this post.) Here's a graphical depiction of the crime rates and all of the variables I considered:

Key: VIC, violent crimes per 100,000 persons; VPC, violent+property+crimes per 100,000 persons; BLK, blacks as a proportion of population; ENL (active-duty, male, enlisted personnel as a proportion of population aged 15-24; GRO(C), growth of real GDP per capita as a proxy for year-to-year growth (GRO) used in the regression analysis; PRS, prisoners in federal and State penitentiaries as a proportion of population; SNT, mandatory sentencing guidelines in effect (0 = no, 1 = yes); YNG, persons aged 15-24 as a proportion of population.A few comments about each of the explanatory variables: BLK, unfortunately, stands for a segment of the population that has more than its share of criminals -- and victims. Having more men in the armed forces (ENL) should reduce, to some extent, the number of crime-prone men in the civilian population. (It would also help to alleviate our self-inflicted impotence, by putting more "boots on the ground" -- and missiles in readiness.) I use the annual rate of real, per-capita economic growth (GRO) to capture the rate of employment -- or unemployment -- and the return on employment, namely, income. (The use of year-over-year growth vice cumulative growthavoids collinearity with the other variables.) PRS encompasses not only the effects of taking criminals off the streets, but the means by which that is done: (a) government spending on criminal justice and (b) juries' and courts' willingness to put criminals behind bars and keep them there for a good while. SNT ensures that convicted criminals are put away for a good while.
I focused on violent-plus-property crime (VPC) as the dependent variable, for two reasons. First, there is a lot more property crime than violent crime (VIC); that is, VPC is a truer measure of the degree to which crime affects Americans. Second, exploratory regression runs on VPC yielded more robust results than those on VIC.
Even at that, it is not easy to tease meaningful regressions from the data, given high correlations among several of the variables (e.g., mandatory sentencing guidelines and prison population, number of blacks and prison population, male enlistees and number of blacks). The set of six explanatory variables -- taken one, two, three, four, five, and six at a time -- can be used to construct 63 different equations. I estimated all 63, and rejected all of those that returned coefficients with counterintuitive signs (e.g., negative on BLK, positive on GRO).
Result and Discussion
Of the 63 equations, I chose the one that has the greatest number of explanatory variables, where the sign on every explanatory variable is intuitively correct, and -- given that -- also has the greatest explanatory power (as measured by its R-squared):
VPC (violent+property crimes per 100,000 persons) =Even though the coefficient on GRO isn't strongly significant, it isn't negligible, and the sign is right -- as are the signs on BLK and PRS. The sign on the intercept is counterintuitive -- the baseline rate of crime could not be negative. The negative sign indicates the omission of key variables. But forcing variables into a regression causes some of them to have counterintuitive signs when they are highly correlated with other, included variables.
-33174.6
+346837BLK (number of blacks as a decimal fraction of the population)
-3040.46GRO (previous year's change in real GDP per capita, as a decimal fraction of the base)
-1474741PRS (the number of inmates in federal and State prisons in December of the previous year, as a decimal fraction of the previous year's population)
The t-statistics on the intercept and coefficients are 19.017, 21.564, 1.210, and 17.253, respectively; the adjusted R-squared is 0.923; the standard error of the estimate/mean value of VPC = 0.076.
The minimum, maximum, and mean values of the dependent and explanatory variables:VPC: 1887, 5950, 4773 (violent-plus-property crimes/100,000 persons)
BLK: 0.1052, 0.1300, 0.1183 (blacks/population)
GRO: -0.02866, 0.06263, 0.02248 (growth in real GDP per capita during year n-1/real GDP per capita in year n-2)
PRS: 0.0009363, 0.004842, 0.002243 (federal and State prisoners in December of year n-1/average population in year n-1)
In any event, the equation specified above does a good job of explaining variations in the crime rate:
 I especially like the fact that the equation accounts for two policy-related variables: GRO and PRS:
1. Crime can be reduced if economic growth is encouraged by rolling back tax rates. Crime will rise if growth is inhibited by raising tax rates (even for the very rich).
2. Crime can be reduced by increasing the rate at which it is prosecuted successfully, and by ensuring that prisoners do not receive lenient sentences. Therefore, we need to (a) spend even more on the pursuit of criminal justice and (b) restore mandatory sentencing guidelines, which had been in effect (and effective) from 1989 to 2004. (Look at the relationship between SNT and the indices of crime, in the next-to-last graph, and you will have no doubt that mandatory sentencing guidelines were effective and are represented in the equation -- to some extent -- by the variable PRS.)
ENL and YNG, like SNT, are key determinants of the crime rate. Each of the three variables appears, with the right sign, in many of the 63 equations. So, I am certainly not ruling out ENL and YNG as important variables. To the contrary, they are important variables. But, just as with SNT, I can't satisfactorily quantify their importance because of the limitations of regression analysis.
Crime, then, depends mainly on two uncontrollable variables (BLK and YNG), and four controllable ones: ENL, GRO, PRS, and SNT. The controllable variables are salutary means of reducing crime, and the record shows that they work. Whatever else abortion is, it is not a crime-fighting tool; those who herald abortion as such are flirting with genocide.
Related posts:
Does Capital Punishment Deter Homicide?
Libertarian Twaddle about the Death Penalty
Crime and Punishment
Abortion and Crime
Saving the Innocent?
Saving the Innocent?: Part II
More on Abortion and Crime
More Punishment Means Less Crime
More About Crime and Punishment
More Punishment Means Less Crime: A Footnote
Clear Thinking about the Death Penalty
Let the Punishment Fit the Crime
Another Argument for the Death Penalty
Less Punishment Means More Crime
__________
Sources
Crimes per 100,000 persons, 1960-2002: Historical Statistical Abstracts, No. HS--23. Crimes and Crime Rates by Type of Offense: 1960 to 2002 (http://www.census.gov/statab/hist/02HS0023.xls).
Crimes per 100,000 persons, 2003-04: Statistical Abstracts, Table 295. Crimes and Crime Rates by Type of Offense: 1980 to 2004 (http://www.census.gov/compendia/statab/tables/07s0295.xls).
U.S resident population, 1960-99: Historical Statistical Abstracts, No. HS-2. Population Characteristics: 1900 to 2002 (http://www.census.gov/statab/hist/02HS0002.xls).
U.S. resident population, 2000-05: Statistical Abstracts, Table 13. Resident Population by Sex, Race, and Hispanic Origin Status: 2000 to 2005 (http://www.census.gov/popest/national/asrh/NC-EST2005/NC-EST2005-03.xls).
Persons aged 15-24, 1960-2002: Historical Statistical Abstracts, No. HS-3. Population by Age: 1900 to 2002 (http://www.census.gov/statab/hist/02HS0003.xls).
Persons aged 15-24, 2003-04: Statistical Abstracts, Table 11. Resident Population by Age and Sex: 1980 to 2005 (http://www.census.gov/compendia/statab/tables/07s0011.xls).
Blacks, 1960-99: Historical Statistical Abstracts, No. HS-2. Population Characteristics: 1900 to 2002 (http://www.census.gov/statab/hist/02HS0002.xls).
Blacks, 2000-04: Statistical Abstracts, Table 13. Resident Population by Sex, Race, and Hispanic Origin Status: 2000 to 2005 (http://www.census.gov/compendia/statab/tables/07s0013.xls). Specifically, I used the entry "Black or African American," under "Race alone or in combination." Regardless of the entry for "black" chosen from the table, there is a discontinuity between the number of blacks in 1999 (preceding source) and the number of blacks in 2000. To eliminate the discontinuity, I derived the growth rate for the number of blacks during 2000-05 (about 0.04 percent/year) and applied that rate to the number of blacks in 1999, for a consistent and continuous estimate of blacks as a percentage of population.
Real GDP per Capita, 1960-2004: What Was GDP Then? (Louis D. Johnston and Samuel H. Williamson, "The Annual Real and Nominal GDP for the United States, 1790 - Present." Economic History Services, July 27, 2007, URL : http://eh.net/hmit/gdp/).
Federal and State prisoners, 1960-2001: Historical Statistical Abstracts, No. HS-24. Federal and State Prisoners by Jurisdiction and Sex: 1925-2001 (http://www.census.gov/statab/hist/02HS0024.xls).
Federal and State prisoners, 2002-04: Statistical Abstracts, Table 337. Federal and State Prisoners by Sex: 1980 to 2004 (http://www.census.gov/compendia/statab/tables/07s0337.xls).
Male enlisted personnel in the armed forces, 1960-2004: Statistical Abstracts, Table 500. Department of Defense Personnel: 1960 to 2005 (http://www.census.gov/compendia/statab/tables/07s0500.xls).
Sentencing guidelines: Start here: United States Sentencing Commission.
