UPDATED 01/05/06
In Freakonomics, Steven Levitt rehashed an earlier paper he wrote with John Donohue, in which the two economists posit a strong relationship between the legalization of abortion in the early 1970s and the drop in the crime rate, which began around 1990. Here's how The Washington Post summarizes what Freakonomics has to say about the relationship between abortion and crime:
. . . First, Freakonomics shows that although commonly cited factors such as improved policing tactics, more felons kept in prison and the declining popularity of crack account for some of the national reduction in crime that began in about the year 1990, none of these completes the explanation. (New York City and San Diego have enjoyed about the same percentage decrease in crime, for instance, though the former adopted new policing tactics and the latter did not.) What was the significance of the year 1990, Levitt asks? That was about 16 years after Roe v. Wade . Studies consistently show that a disproportionate number of crimes are committed by those raised in broken homes or who were unwanted as children. When abortion became legal nationally, Levitt theorizes, births of unwanted children declined; 16 years later crime began to decline, as around age 16 is the point at which many once-innocent boys start their descent into the criminal life. Leavitt's [sic] clincher point is that the crime drop commenced approximately five years sooner in Alaska, California, Hawaii, New York and Washington state than it did in the nation as a whole. What do these states have in common? All legalized abortion about five years before Roe .Levitt has defended his findings against some well-qualified critics, most notably Steve Sailer (see here, here, here, and here, for example) and economists Christopher L. Foote and Christopher F. Goetz. If you're interested in the minutiae of the debate, go here, where Levitt also discusses the sideshow involving Bill Bennett. Bennett, as you recall, created a stir with this colloquy during the September 28, 2005, broadcast of Salem Radio Network's Bill Bennett'’s Morning in America:
BENNETT: . . . one of the arguments in this book Freakonomics that they make is that the declining crime rate, you know, they deal with this hypothesis, that one of the reasons crime is down is that abortion is up. Well . . .—Rather than rehash all the debates about Levitt's work and Bennett's statement, I decided to take a fresh look at the numbers. I drew on the U.S. Census Bureau's "Mini-Historical Statistics" to derive the following statistics for the United States (each descriptor links to the Excel spreadsheet from which I derived the relevant statistics):
CALLER: Well, I don'’t think that statistic is accurate.
BENNETT: Well, I don'’t think it is either, I don'’t think it is either, because first of all, there is just too much that you don't know. But I do know that it'’s true that if you wanted to reduce crime, you could . . . —if that were your sole purpose, you could abort every black baby in this country, and your crime rate would go down. That would be an impossible, ridiculous, and morally reprehensible thing to do, but your crime rate would go down. So these far-out, these far-reaching, extensive extrapolations are, I think, tricky.
Violent crimes per 100,000 personsI selected the 15-24 year age range because persons in that age bracket are most prone to the commission of violent crimes. Because the midpoint of that age bracket is approximately 19, I lagged the birth statistics by 19 years so that birth rates in a particular year are measured against crime statistics 19 years later (e.g., births in 1960 vs. crime in 1977, births in 1973 vs. crime in 1990). I used the overall rate of incarceration rather than a rate for violent offenders because locking up offenders of any kind must ensure that persons who would otherwise commit violent crimes are unable to do so.
Percentage of population aged 15-24
Births and illegitimate births per 100,000 women aged 15-19
Blacks as a percentage of the population
Persons incarcerated per 100,000
Before plunging into a regression analysis, I indexed the series to 1960 (the first year in the violent-crime series) and plotted them (again, with a 19-year lag on the birth-rate series). Here are the plots:
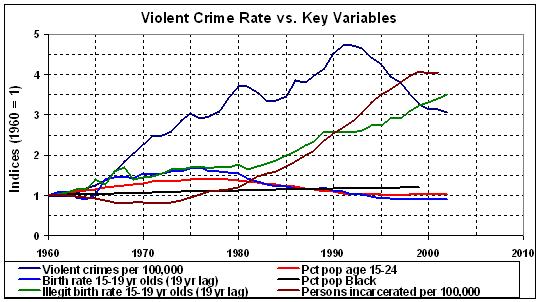
The relationships suggest strongly that the legalization of abortion did not have a significant effect on the rate of violent crime in the U.S. The violent-crime rate rose almost steadily from 1960 until 1991, when it peaked. The lagged rate of illegitimate births for women aged 15-19 (probably the best available proxy for "unwanted" children) leveled off about when the crime rate peaked, but the illegitimacy rate then resumed its steady rise, even as the violent-crime rate dropped dramatically. It is therefore improbable (if not impossible) that abortion -- as measured by the rate of illegitimate births -- had anything to do with the drop in the crime rate. Using the total rate of births for women aged 15-19 as a proxy for "unwantedness" yields even more problematic results: the lagged rate peaked in 1976, fully 15 years before the crime rate peaked.
I nevertheless ran many regressions on the violent-crime rate and various combinations of the key variables. Only one regression yields credible results (high R-squared, standard error of estimate among the lowest, intuitively correct signs on all coefficients, and high t-statistics on all coefficients). That regression takes the following form:
Number of violent crimes per 100,000 persons =That equation is especially compelling because both explanatory variables are statistically signficant even though they are strongly correlated (R = 0.84). Given that, and the evidence of the plots above -- in which the declining crime rate is accompanied by a rising incarceration rate -- two things are evident: incarceration is the key to crime reduction, and abortion has no place in the discussion of crime. What happened was that the incarceration rate finally became high enough, around 1991, to offset the countervailing influences on crime.
- 3723
+ 37058 x number of Blacks as a decimal fraction of the population
- 0.568 x number of persons incarcerated per 100,000 of population
The t-statistics on the intercept and coefficients are -15.854, 17.047, and -5.042, respectively; the adjusted R-squared is 0.936; the standard error of the estimate is 47.0.
The mean value of the dependent variable is 483.1, with a range of 158.1 to 758.2. The corresponding values for proportion of blacks: 0.117, 0.105, 0.125; for incarceration rate: 202.4, 93, 476.
The years represented in the regression are 1960-99 (the last year of data on Blacks as a fraction of the population).
Incarceration follows from prosecution, which follows from investigation. I therefore stand by my earlier conclusion that "incarceration and spending on the criminal justice system . . . . are the public-policy weapons of choice" when it comes to fighting crime.
UPDATE (01/04/06): None of my regressions (not even the best one) fully accounts for the sharp decline in the violent-crime rate after 1990. That is because I did not try to model the effects of concerted efforts, since the late 1980s, to put violent offenders behind bars and to keep them there longer. The missing variable, of course, is to be found in the effectiveness of federal sentencing guidelines, which were enacted in 1987 and declared constitutional by the U.S. Supreme Court in 1989. Liberal do-gooders and their allies on the bench nevertheless persuaded the Supreme Court last year (in a pair of related cases) to find the guidelines unconstitutional and, therefore, only advisory rather than mandatory.
Given the inevitability of more lenient sentencing in many jurisdictions, I predict that the violent-crime rate will resume its long-term ascent. That ascent will mirror the continuing destruction of civil society at the hands of liberals -- and those libertarians who seem unable to grasp the notion that liberty must be defended, at home and abroad.
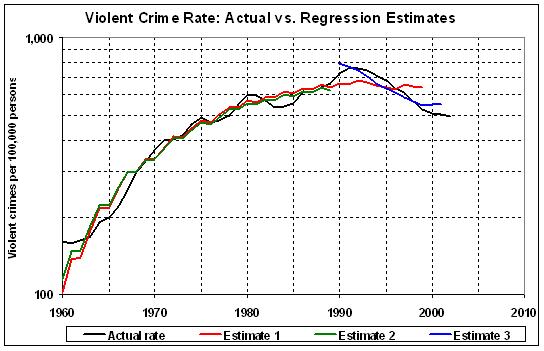
UPDATE (01/05/06): In light of the preceding update I ran separate regressions on the violent crime rate for two periods: 1960-89 and 1990-2001, 1990 being the first full year under the federal sentencing guidelines. The best regression for 1960-89 has the same two explanatory variables above. The best regression for 1990-2001 (the last year of my series on incarceration rate) has only one explanatory variable: number of persons incarcerated per 100,000 of population. The graph below gives plots of the following statistics and regression estimates:
- actual rate of violent crimes (per 100,000 persons)
- estimates for the original regression (estimate 1)
- estimates for the separate regressions on 1960-89 (estimate 2) and 1990-2001 (estimate 3).
P.S., here are the numbers:
1. As in the original portion of the post.
2. Number of violent crimes per 100,000 persons =
- 3496
+ 34964 x number of Blacks as a decimal fraction of the population
- 0.528 x number of persons incarcerated per 100,000 of population
The t-statistics on the intercept and coefficients are -19.241, 20.544, and -2.982, respectively; the adjusted R-squared is 0.936; the standard error of the estimate is 47.0.3. Number of violent crimes per 100,000 persons =
The mean value of the dependent variable is 419.8, with a range of 158.1 to 666.9. The corresponding values for proportion of blacks: 0.114, 0.105, 0.122; for incarceration rate: 139.6, 93, 276.
The years represented in the regression are 1960-89, as explained in this update.
1216 - 1.413 x number of persons incarcerated per 100,000 of populationThe "Black" variable drops out of #3 because it is almost constant during the relevant period. It is "working" in the background to produce a high crime rate, but the "incarceration" variable has a measurable countervailing effect on crime.
The t-statistics on the intercept and coefficients are 15.976 and -7.595, respectively; the adjusted R-squared is 0.837; the standard error of the estimate is 40.4.
The mean value of the dependent variable is 645.0, with a range of 506.5 to 758.2. The corresponding values for incarceration rate: 404.5, 297, 476.
The years represented in the regression are 1990-2001, as explained in this update.
Related posts:
Does Capital Punishment Deter Homicide?
Libertarian Twaddle about the Death Penalty
Crime and Punishment
Abortion and Crime
Saving the Innocent?
Saving the Innocent?: Part II
More on Abortion and Crime
More About Crime and Punishment
More Punishment Means Less Crime: A Footnote
Clear Thinking about the Death Penalty
Let the Punishment Fit the Crime
Another Argument for the Death Penalty
Less Punishment Means More Crime
Crime, Explained
