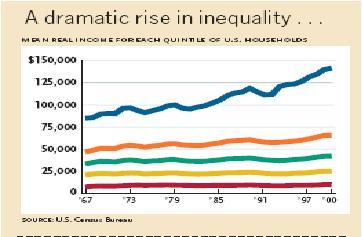
Looks bad, doesn't it? If you didn't know anything about the underlying dynamics, you'd think that the poorest American households made almost no progress in more than 30 years. Bradbury and Katz then try to convince their readers that it really is bad because the patterns of mobility between quintiles have changed little in recent decades:
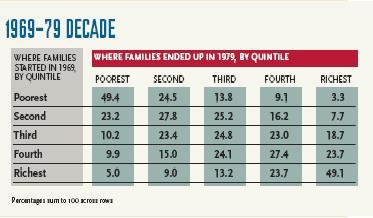

What those "stable" patterns really mean is something quite different than Bradbury and Katz would have us believe. If you do the math correctly, you find that in a stable population only about 25 percent of the households that were in the poorest quintile in the late 1960s were still there a generation (about 30 years) later. Similarly, only about 25 percent of the households that were in the richest quintile in the late 1960s were still there a generation later. A small fraction of households stay in the same quintile; a smaller fraction move out of that quintile and then come back to it; most leave, never to return.
Actually, the percentage of households that remained in the poorest quintile in the last one-third of the 20th century must have been far less than 25 percent. The number of households wasn't stable during that period (nor will it remain stable). According to the Census Bureau, the number of households increased from about 63 million in 1970 to about 103 million in 2000 (and will continue to grow by more than 1 million a year). What income quintile do you suppose is occupied by most new households, which consist mainly of young couples and immigrants*? The bottom quintile, of course.
So, let's take population growth into account. The bottom quintile consisted of about 13 million households in 1970 (one-fifth of the total of 63 million). Of those 13 million, only about 3 million (25 percent) remained there in 2000. But by 2000, the bottom quintile consisted of about 21 million households (one-fifth of the total of 103 million). Therefore, at the end of the 20th century, only about 15 percent of the households (3 million of 21 million) then in the bottom quintile had been there for a generation.
The first graph really should look something like this:
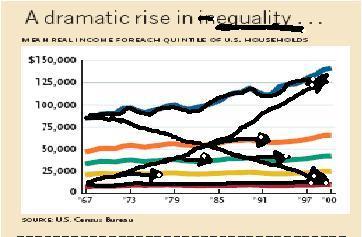
I've kept it simple by omitting most of the inter-quintile movement, but you get the idea. The way I've drawn it is the way it really happens, according to the numbers kindly provided by Bradbury and Katz.
All Bradbury and Katz have shown us is that new households are generally poorer than more established households. What they haven't shown us -- because it's untrue -- is that households that start at the bottom stay at the bottom. Nor do households that start at the top stay at the top.
__________
* See Robert J. Samuelson's column, "The Changing Face of Poverty," in this week's Newsweek. Here are the key points about immigrants and poverty:
...For 2003, the Census Bureau estimated that 35.9 million Americans had incomes below the poverty line; that was about $12,000 for a two-person household and $19,000 for a four-person household. Since 2000, poverty has risen among most racial and ethnic groups. Again, that's the recession and its after-math. But over longer periods, Hispanics account for most of the increase in poverty. Compared with 1990, there were actually 700,000 fewer non-Hispanic whites in poverty last year. Among blacks, the drop since 1990 is between 700,000 and 1 million, and the poverty rate—though still appallingly high—has declined from 32 percent to 24 percent. (The poverty rate measures the percentage of a group that is in poverty.) Meanwhile, the number of poor Hispanics is up by 3 million since 1990. The health-insurance story is similar. Last year 13 million Hispanics lacked insurance. They're 60 percent of the rise since 1990.
To state the obvious: not all Hispanics are immigrants, and not all immigrants are Hispanic. Still, there's no mystery here. If more poor and unskilled people enter the country—and have children—there will be more poverty. (The Census figures cover both legal and illegal immigrants; estimates of illegals range upward from 7 million.) About 33 percent of all immigrants (not just Hispanics) lack a high-school education. The rate among native-born Americans is about 13 percent. Now, this poverty may or may not be temporary. Some immigrants succeed quickly; others do not....
