Far better is the Dow Jones Wilshire 5000 Composite Index (better known as the Wilshire 5000), which now tracks about 5,400 U.S. stocks and is weighted by the market capitalization of those stocks. There is a total-return version of the index that includes gains from reinvested dividends, as opposed to price gains only. (I obtain monthly values for the total-return index here.)
When adjusted for inflation, the total-return index gives a good indication of the state of the U.S. stock market as a long-term investment vehicle. (I use the CPI-U, available here, as the measure of inflation.)
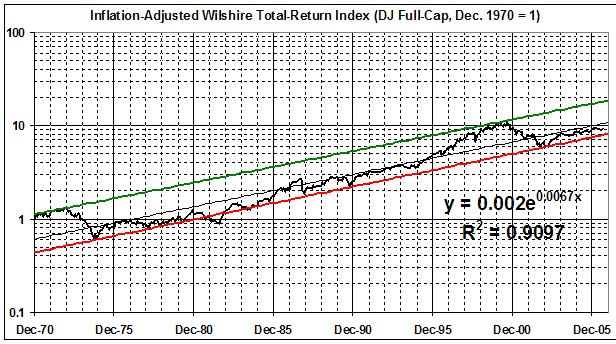
The green and red lines trace the "trading channel" around the long-term trend (black line), the equation for which is shown on the chart. The long-term trend represents a real, annual gain of 8.4 percent a year, with dividends reinvested.
It's evident that the cumulative value of U.S. stocks, in real terms, remains well below the speculative peak of six years ago. That's just as well. We are seeing steady, restrained growth in the inflation-adjusted cumulative index -- much like that of the late '80s and early '90s -- which is a good sign for the stock market and for the economy.