| 1. Most Regular-Season Home Runs, Career | |||||
| Player | Years | Times led league in HR | Total HR | Total AB | HR per AB |
| Hank Aaron | 1954-1976 | 4 | 755 | 12,364 | 0.061 |
| Babe Ruth | 1914-1935 | 12 | 714 | 8,398 | 0.085 |
| Barry Bonds | 1986-2005 | 2 | 708 | 9,140 | 0.077 |
| Willie Mays | 1951-1973 | 4 | 660 | 10,881 | 0.061 |
| Sammy Sosa | 1989-2005 | 2 | 588 | 8,401 | 0.070 |
| Frank Robinson | 1956-1976 | 1 | 586 | 10,006 | 0.059 |
| Mark McGwire | 1986-2001 | 4 | 583 | 6,187 | 0.094 |
| Harmon Killebrew | 1954-1975 | 6 | 573 | 8,147 | 0.070 |
| Rafael Palmeiro | 1986-2005 | 0 | 569 | 10,472 | 0.054 |
| Reggie Jackson | 1967-1987 | 4 | 563 | 9,864 | 0.057 |
The right column of Table 1 (home runs per at-bat) gives away one of the shortcomings of looking at total home runs; namely, that statistic recognizes longevity as much as it does prowess. Let's look, instead, at career leaders ranked by home runs per at-bat, first including active players under the age of 40 (Table 2) and then excluding them (Table 3):
| 2. Most Regular-Season Home Runs per At-Bat, Career* | |||||
| Player | Years | Times led league in HR | Total HR | Total AB | HR per AB |
| Mark McGwire | 1986-2001 | 4 | 583 | 6,187 | 0.094 |
| Babe Ruth | 1914-1935 | 12 | 714 | 8,398 | 0.085 |
| Barry Bonds | 1986-2005 | 2 | 708 | 9,140 | 0.077 |
| Jim Thome | 1991-2005 | 1 | 430 | 5,919 | 0.073 |
| Manny Ramirez | 1993-2005 | 1 | 435 | 6,126 | 0.071 |
| Ralph Kiner | 1946-1955 | 7 | 369 | 5,205 | 0.071 |
| Harmon Killebrew | 1954-1975 | 6 | 573 | 8,147 | 0.070 |
| Sammy Sosa | 1989-2005 | 2 | 588 | 8,401 | 0.070 |
| Alex Rodriguez | 1994-2005 | 4 | 429 | 6,195 | 0.069 |
| Ken Griffey Jr. | 1989-2005 | 4 | 536 | 7,870 | 0.068 |
| * Includes active players with a minimum of 3,000 plate appearances. | |||||
| 3. Most Regular-Season Home Runs per At-Bat, Career* | |||||
| Player | Years | Times led league in HR | Total HR | Total AB | HR per AB |
| Mark McGwire | 1986-2001 | 4 | 583 | 6,187 | 0.094 |
| Babe Ruth | 1914-1935 | 12 | 714 | 8,398 | 0.085 |
| Barry Bonds | 1986-2005 | 2 | 708 | 9,140 | 0.077 |
| Ralph Kiner | 1946-1955 | 7 | 369 | 5,205 | 0.071 |
| Harmon Killebrew | 1954-1975 | 6 | 573 | 8,147 | 0.070 |
| Sammy Sosa | 1989-2005 | 2 | 588 | 8,401 | 0.070 |
| Ted Williams | 1939-1960 | 4 | 521 | 7,706 | 0.068 |
| Dave Kingman | 1971-1986 | 2 | 442 | 6,677 | 0.066 |
| Mickey Mantle | 1951-1968 | 4 | 536 | 8,102 | 0.066 |
| Jimmie Foxx | 1925-1945 | 4 | 534 | 8,134 | 0.066 |
| * Includes only those active players who are 40 years of age or older. | |||||
Tables 2 and 3 give a better indication of prowess than Table 1, but they do not take into account how the game of baseball has changed with time. A way to do that is to see how often a player excelled at hitting home runs, relative to his peers:
| 4. Most Seasons Leading League in Home Runs* | |||||
| Player | Years | Times led league in HR | Total HR | Total AB | HR per AB |
| Babe Ruth | 1914-1935 | 12 | 714 | 8,398 | 0.085 |
| Mike Schmidt | 1972-1989 | 8 | 548 | 8,352 | 0.066 |
| Ralph Kiner | 1946-1955 | 7 | 369 | 5,205 | 0.071 |
| Harmon Killebrew | 1954-1975 | 6 | 573 | 8,147 | 0.070 |
| Mel Ott | 1926-1947 | 6 | 511 | 9,456 | 0.054 |
| Mark McGwire | 1986-2001 | 4 | 583 | 6,187 | 0.094 |
| Alex Rodriguez | 1994-2005 | 4 | 429 | 6,195 | 0.069 |
| Ted Williams | 1939-1960 | 4 | 521 | 7,706 | 0.068 |
| Ken Griffey Jr. | 1989-2005 | 4 | 536 | 7,870 | 0.068 |
| Mickey Mantle | 1951-1968 | 4 | 536 | 8,102 | 0.066 |
| Jimmie Foxx | 1925-1945 | 4 | 534 | 8,134 | 0.066 |
| Hank Greenberg | 1930-1947 | 4 | 331 | 5,193 | 0.064 |
| Willie Mays | 1951-1973 | 4 | 660 | 10,881 | 0.061 |
| Hank Aaron | 1954-1976 | 4 | 755 | 12,364 | 0.061 |
| Reggie Jackson | 1967-1987 | 4 | 563 | 9,864 | 0.057 |
| Johnny Mize | 1936-1953 | 4 | 359 | 6,443 | 0.056 |
| Hack Wilson | 1923-1934 | 4 | 244 | 4,760 | 0.051 |
| Chuck Klein | 1928-1944 | 4 | 300 | 6,486 | 0.046 |
| Cy Williams | 1912-1930 | 4 | 251 | 6,780 | 0.037 |
| * Excludes players who compiled most of their at-bats before 1920. | |||||
The criterion used in Table 4 still falls short because it doesn't take into account home-run frequency, which -- as I suggest above -- is a better indicator of prowess. Thus this comparison:
| 5. Most Seasons Leading League in Home Runs per At-Bat* | |||||
| Player | Seasons | Times led league in HR/AB | Total HR | Total AB | HR/AB |
| Babe Ruth | 1914-1935 | 13 | 714 | 8,398 | 0.085 |
| Mel Ott | 1926-1947 | 10 | 511 | 9,456 | 0.054 |
| Mark McGwire** | 1986-2001 | 8 | 583 | 6,187 | 0.094 |
| Barry Bonds | 1986-2005 | 8 | 708 | 9,140 | 0.077 |
| Ralph Kiner | 1946-1955 | 7 | 369 | 5,205 | 0.071 |
| Harmon Killebrew | 1954-1975 | 6 | 573 | 8,147 | 0.070 |
| Ted Williams | 1939-1960 | 6 | 521 | 7,706 | 0.068 |
| Mike Schmidt | 1972-1989 | 6 | 548 | 8,352 | 0.066 |
| Willie McCovey | 1959-1980 | 5 | 521 | 8,197 | 0.064 |
| Cy Williams | 1912-1930 | 5 | 251 | 6,780 | 0.037 |
| Manny Ramirez | 1993-2005 | 4 | 435 | 6,126 | 0.071 |
| Jimmie Foxx | 1925-1945 | 4 | 534 | 8,134 | 0.066 |
| Willie Mays | 1951-1973 | 4 | 660 | 10,881 | 0.061 |
| * Excludes players who compiled most of their at-bats before 1920. | | ||||
| ** McGwire switched leagues during the 1997 season. His totals for the entire season gave him a better HR/AB record than the official leader in either league. I have therefore credited McGwire with leading in HR/AB 8 times, as against his official record of leading 7 times. | |||||
There we have it, dominance against one's peers by a purer measure of prowess: home runs per at-bat in a season. Even purer measures are possible. As a Sabermetrician would tell you, seasonal performance should be adjusted for the characteristics of the ballparks a player played in, for the quality of the teams he played on (relative to the opposition), the equipment, the rules (e.g., height of the pitching mound), and so on.
Such adjustments might, for example, knock Mel Ott from his second-place perch because Ott (a left-handed batter) played his entire career (about one-half of his games) at the Polo Grounds, with its short foul lines (only 258 feet down the right-field line) and cavernous center field:
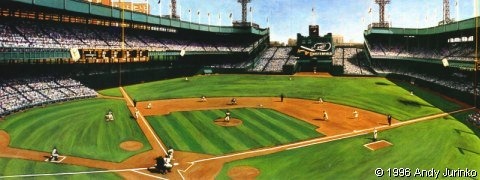
But Ott had to pull the ball sharply to take advantage of the peculiar geometry of the Polo Grounds, which meant that he had to adopt and perfect a peculiar batting style (a matter of skill). Because of that style, pitchers could more easily avoid throwing him pitches that he could pull, and fielders could more readily position themselves to defend the outfield gaps. In spite of that, Ott compiled a lifetime batting average of .304 while leading his league in HR/AB 10 times! Ott stays on the list, as do the other odd-balls:
- Barry Bonds and Mark McGwire, with their weight-training and performance-enhancing substances.
- Cy Williams, a left-handed batter who compiled a lot of his home runs in the friendly confines of Baker's Bowl, with its "short porch" in right field -- only 280 feet down the line, and not much more than that into right-center:
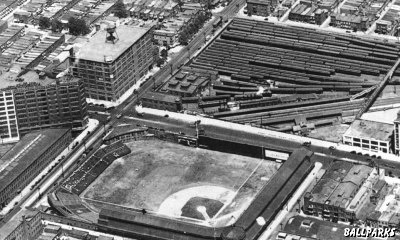
But Willams wasn't a fluke. He led his league in AB/HR five times in a 12-season span (1916-1927), and batted .292 over the course of his career, almost half of which was in the "dead ball" era.
It's impossible, really, to compare players who were not contemporaries. That's why I like Table 5. It affords the best picture of home-run prowess across time. Ruth still stands at the top of the list; the long-forgotten Mel Ott and Cy Williams are restored to the prominence they enjoyed when they played; and Ralph Kiner, Harmon Killebrew, Ted Williams, Mike Schmidt, and Willie McCovey re-gain their proper places of pre-eminence, unshadowed by players who racked up home runs through sheer longevity. Should McGwire and Bonds really be listed among the greats? Certainly they were the greats of their era, however they got there. That's all I have to say about that -- for now.
And so, with the help of Table 5, we can trace the succession of pre-eminent home-run hitters who played most or all of their careers in the "lively ball" era:
- American League -- Babe Ruth (13 times in the span from 1918 through 1931), Jimmie Foxx (4 times during 1932-1939), Ted Williams (6, 1941-1957), Harmon Killebrew (6, 1959-1970), Mark McGwire (6, 1987-1997), and Manny Ramirez (4, 1999-2005). Those six players combined to lead the league in HR/AB in 39 of the 88 seasons from 1918 through 2005.
Go back to hitters who played mostly in the "dead ball" era and you find Frank (Home Run Baker) and Harry Davis, who dominated the AL's home run lists (such as they were). Davis was a 4-time leader in HR/AB, from 1904 through 1907; Baker, a 4-time leader in the span from 1911 through 1916. Throw in, from the "lively ball" era, Lou Gehrig (2 times), Hank Greenberg (3), Gus Zernial (3), Mickey Mantle (2), Norm Cash (2), Dick Allen (2), Gorman Thomas (2), Reggie Jackson (2), Ron Kittle (2), Jose Canseco (2), Ken Griffey (2), and Jim Thome (2). Now you have a list of 20 players who combined to lead the AL in 73 of the 102 seasons from 1904 through 2005. That's a select group of fearsome sluggers.
- National League -- Cy Williams (5 times in the span of 1916 through 1927), Mel Ott (10 times, 1929-1944), Ralph Kiner (7, 1947-1952), Willie Mays (4, 1955-1965), Willie McCovey (5, 1963-1970), Mike Scmidt (6, 1974-1986), and Barry Bonds (8, 1992-2004). Those seven players combined to lead the league in HR/AB in 45 of 90 seasons from 1916 through 2005.
Now add Gavvy Cravath, another name from the "dead ball" era. Cravath -- Ruth's predecessor as all-time leader in total home runs -- led the NL in HR/AB 6 times during the seven seasons of 1912 through 1918. Throw in, from the "lively ball" era, Rogers Hornsby (2), Hack Wilson (2), Wally Berger (2), Eddie Matthews (3), Hank Aaron (3), Dave Kingman (3), George Foster (2), Darryl Strawberry (3), and Mark McGwire (2, his 70 and 65 HR seasons) and you have a mere 17 players who combined to lead the NL in 73 of the 94 seasons from 1912 through 2005. Another select group of dominating sluggers.
To see who filled the gaps, go here.
ACKNOWLEDGEMENTS: Players' statistics from Baseball-Reference.com; ballpark stats and photos from Ballparks by Munsey and Suppes.
